


How to create a successful software solution? First of all, you should verify that it is effective and high-quality and will bring value to the final users.
The main metrics for software quality address different aspects of the application, including its features, functions, and the process for designing each program. In general, software quality metrics are a core aspect of software development and maintenance. These metrics describe the solution’s usability, functionality, and efficiency.
Learning about various software development metrics can enable you to create quality programs that meet customer expectations. In this article, we will consider metrics for software quality and explain the importance of using software quality metrics. Also, we will share several options for metrics to use in your work, such as cycle time, lead time, backlog management index, and others.
So, let’s start!
The role of software quality measuring
So first is quality, but what else is behind the hype over measuring software quality in one word? Revenue. According to Global Market Insights, nowadays, the role of software testing in making money is increasing, with more than $40 billion generated, and is anticipated to record a CAGR (compound annual growth rate) of more than 6 % between 2022 and 2030.
The widespread adoption of artificial intelligence improves the testing process by automating some parts of the quality control procedure and facilitating decision-making. Nevertheless, the demand for manual QA (quality assurance) will not decrease. On the contrary, it’s expected to rise by 2032 as new products are constantly entering the scene.

Benefits you get from using software quality metrics
Being attentive to quality metrics in software testing and engineering means keeping your eye on the ball. Regular monitoring of the situation allows you to manage the further course of the game and win – make a valuable product. Make sure all software development team members realize the potential of qualitative tests, as this leads you to:

- Faster execution of tasks. On average, data analysts spend 80% of their time cleaning and sorting out data instead of focusing on the analysis. At the same time, software quality indicators speed up data processing and allow specialists to spend their efforts on solving more urgent tasks.
- Clarity in all processes. Having visibility of what’s going on at each stage of the product’s building, testing, and maintenance are the keys to identifying and resolving misunderstandings in complex projects. Providing specific QA standards upfront will help keep the team on the same page.
- Facilitating prioritization. By using a set of relevant metrics, you make life easier for the PM (project manager), whose primary responsibility is to track the project’s progress and lead the team in the right direction. Based on the results of the analysis, project managers can rationally prioritize tasks instead of following intuition.
- Effective management. To ensure that your software product is on schedule, you need metrics. Anticipate possible risks, estimate the timing of future steps, and make changes along the way when necessary.
- Better decision-making. Metrics bring objectivity to the table, so you avoid impulsive decisions and costly mistakes. Instead, your project will be optimized to meet your software quality assurance goals.
Aspects that define that your software is quality
You’ve already learned which benefits can drive you to choose different types of software testing quality metrics. Now, you might be wondering what they are doing with your product, right? Below, we mention all the improvements you will obtain if you take into account all metrics for software quality.
Your solution is stable
Nobody likes to use software that often crashes or runs slowly. Bugs annoy customers, so regularly checking your app for bugs will tell you if it’s running smoothly without crashes.
Your product is easy to maintain
Overcomplication will not be your friend when you think of software maintenance. Check it for clarity before the next step! Metrics help you weigh the size, structure, and consistency of your code base to understand the success of your product within it.
Your product supports testing well
The openness to various testing types measures your app’s further upgrade. If the changes require a lot of time and effort, you will probably lose some of your users before you can complete the task. Quality analysis prevents this.
Your solution is portable
Different generations of users prefer different platforms to use. While mobile phones still lead the way – 57% of internet traffic is generated by phone users – market segmentation can significantly influence their preferences. That’s why you should adapt your solution to work well on different devices, and metrics are the foundation for that.
Your product can be reused
Changes in consumer behavior require you to be flexible, which means being willing to make the necessary changes to your product’s functionality, design, and user experience. To do this, engineers need to reuse code easily. With the help of software testing quality metrics, you can measure the interdependence between assets and intelligently plan a new version of the product.

Key product quality metrics to access the value of your solution
Now that you know why you need to measure product quality, it’s time to talk about software quality metrics examples.And we suggest starting with agile metrics that allow your dedicated software development team to focus on improving the software product as it’s being developed.
1. Lead time
This is one of the significant software development quality metrics. It estimates the time engineers spend on idea generation, UX (user experience), and UI (user interface) design and development. The faster the team can get the product out, the more likely your potential customers will find it relevant and useful. For enhanced lead time management, project managers can employ project management software tools, such as Jira, Asana, Trello, and others.

Case in point
When a project commences on February 2nd and is successfully finished on February 12th, the lead time equates to 10 days.
2. Cycle time
Don’t confuse cycle time with lead time, even though they look similar. What differs between them is time. Or, to be precise, the timing of when a project starts and when it is considered complete.
The cycle period starts from the development of the application until the end of the life cycle. In contrast, the lead time begins with the receipt of the order and ends with the delivery of -the finished version. The cycle time metric helps evaluate the time necessary for each development stage and allocate resources correspondingly. This index is measured by the PM (project manager) for individual tasks, user stories, or features.

Сase in point
For example, the team spent 8 days completing 4 tasks, which means the time cycle is 2 days per task.
Following a project’s launch, by tracking lead and cycle times during issue reporting and resolution, one can assess the duration of tasks that are postponed before reaching a resolution. Focusing managerial efforts on reducing wait times in the task queue can mitigate extended delays. This enables the development team to address and resolve issues promptly.
3. Sprint velocity
This is when your PM’s talents should be at their best if you advocate a Scrum approach to planning. The metric determines how much value the team can bring at each sprint. Calculated in story points, this is the amount of work developers can complete under ideal conditions. An important tip here is to be realistic with your estimates, as this will affect the entire planning process. After each sprint, the project manager compares the actual and expected story points to modify the workflow as needed.
The velocity metric shows a discrepancy in the development pace among specialists. Consider adjusting the task distribution process to align developers with tasks that better match their skill sets. So, you can see if there is an observed increase in velocity. This improvement lets you know that the optimization efforts have proven successful.

Case in point
During a two-week sprint, if the team accomplishes user stories with an estimated total of 30 story points, the velocity registers as 30.
4. Capacity
This metric helps to distinguish the team’s ability to tackle and accomplish tasks within a specified timeframe. It showcases the team’s available resources, including individual members’ headcount and skill sets, alongside external factors like time off or concurrent projects. Effective capacity planning ensures that the team can commit to and achieve their sprint objectives. This is the formula to calculate this metric:

Case in point
For instance, if a team comprises six members, each having an average capacity of 30 story points per sprint, the capacity calculation would be 6×30=180 story points.
5. Burndown chart
It is a vital visual metric that represents the team’s progress throughout a sprint or release. This metric provides a clear visualization of the remaining effort, be it in story points or hours, juxtaposed against the passage of time, facilitating insights into the team’s progress toward achieving set goals.
Constructing a burndown chart involves plotting the remaining effort against time, typically in daily increments. Here, the horizontal axis denotes time, often measured in days, while the vertical axis represents the remaining effort, measured in story points or hours.
The ideal trajectory sees the chart commencing at the total estimated effort and progressively descending as tasks are completed.

Here is the formula to this metric:

Through daily scrutiny of the burndown chart, both the PM and the team gain insights into their progress. Any deviations from the anticipated trajectory can be promptly identified. This enables proactive adjustments to correct efforts as necessary.
Core budget tracking metrics
When the team works on the project, a PM should proactively identify budget and schedule deviations. The following metrics offer valuable insights into project performance and help ensure the successful delivery of software products on schedule and within budget.
1. CPI (cost performance index)
This metric helps to assess cost management efficiency within a project. It gauges the relationship between the earned value (the value of completed work) and the actual cost incurred. If the CPI exceeds 1, it indicates that the project is under budget; conversely, if it falls below 1, the project is over budget. Here is the formula:

Case in point
A software development project has earned $60,000 in value but incurred actual costs of $70,000. Applying the CPI formula, we receive 0.85.
2. SPI (schedule performance index)
The index shows the efficiency of schedule management within a project. It measures the ratio of earned value to planned value, indicating whether the project is ahead of or behind schedule. An SPI exceeding 1 signifies that the project is ahead of schedule, while a value below 1 indicates a lag in schedule adherence.

Case in point
If a project has earned $50,000 in value against a planned value of $60,000, using the formula, we obtain 0.83. This metric means the project is behind schedule, achieving only 83% of the planned value.
Essential in-process quality metrics
Are you interested in learning how to obtain software quality assurance metrics during testing? When a QA professional enters the scene, they must check these examples of software development quality metrics:
1. Customer problems
When working on a project, it is important to anticipate possible user problems. The latter includes both problems without defects and problems with defects. They’re calculated in terms of monthly statistics – problems per user-month (PUM). Simply put, the PUM metric shows how the program behaves after each milestone or release. With it, you can improve usability, reproducibility, problem rediscovery, and documentation.

Case in point
For example, specialists (QAs, PMs) control a bug management system for a software application across a four-month span:
- Incidents tackled: A total of 120 issues were identified and resolved.
- User base: The software boasts an active user community of 2000.
- Duration of assessment: The metric spans 4 months.
The resulting PUM is 0.015. This implies that, on average, each user faced or reported 0.015 issues over the four months. A lower PUM generally signals a more positive user experience due to fewer issues encountered per user month.
2. Customer satisfaction
This is another easy way to see how your target audience reacts to the product, especially after making some changes. The customer satisfaction index is usually measured by customer surveys, according to which the level of satisfaction with the use of access is carried out on a five-point scale from very dissatisfied to very satisfied.
By counting the percentage of each customer category, quality control professionals can clearly see whether things are going well or poorly.

Case in point
Let’s consider an example of a comprehensive customer survey in the field of software development:
- Satisfied customers: Out of a user base 500, feedback reveals that 80 customers express contentment with a recent software update.
- Total users: 500 users that apply the software.
In this instance, the calculated customer satisfaction stands at 16%. This data shows that, based on the survey responses, 16% of the overall user base acknowledges satisfaction with the recent software update. Quality control professionals can leverage this metric to evaluate the update’s impact on customer satisfaction, pinpoint areas for enhancement, and make informed decisions for refining the software development process.
3. Code (cyclomatic) complexity
This metric is usually accessed by an automated software tool that takes information from the code and calculates the number of possible independent paths in the program. The higher it is, the more complex the code. Usually, if the code complexity is greater than 10, the code will be difficult to maintain, and the development team should work on simplifying the program.
The cyclomatic complexity measurement transpires during the coding and development phase, often integrated into code reviews or automated static code analysis sessions. QA engineers collaborate with developers to gauge the intricacy of the codebase.
The code complexity metric (V) is determined by considering the number of independent paths within a program’s source code.

- E represents the number of edges in the control flow graph.
- N signifies the number of nodes in the control flow graph.
- P corresponds to the number of connected components (in the case of a single program, P=1).
Case in point
Suppose you have a function in a software program that involves decision points and loops. Here’s a simplified code snippet:

Let’s assume the tool calculates E=14, N=11, and P=1 for this function. In this example, the cyclomatic complexity is 5. According to the guideline mentioned earlier, if the cyclomatic complexity is greater than 10, it may be considered high. In this case, the code is moderately complex. So, the development team might want to review and simplify it to enhance maintainability.
Key maintenance quality metrics
At this stage, the metrics software quality emphasis should focus on fixing the defects in the backlog. Usually, this happens according to DevOps practice, which also aims to ensure high-quality software.
1. Fix backlog
This metric calculates the number of reported issues that remain unresolved by the end of the week or month. Measuring this metric requires close coordination among developers, PMs, and QA teams. Guided by the trend graph, the team gets the opportunity to plan and manage the maintenance process productively.

Case in point
Let’s consider another one of the software quality metrics examples. At the end of the month, a software development team reviews their issue tracking system. They find that there are 25 reported issues that haven’t been resolved. Therefore, the fix backlog metric for the month is 25.
2. Backlog management index
This quality metric is also important for the QA specialist to manage the backlog of issues that are “already fixed” or “waiting to be fixed.” The backlog management index scrutiny occurs during sprint reviews or backlog grooming sessions. Abbreviated as BMI, it is calculated by the following formula:

Сase in point
Within an issue tracking system, the team successfully resolves 50 issues, while 20 issues are yet to be fixed. The calculated BMI stands at 71.43%. This result shows that over 70% of the total issues, both resolved and pending, have been efficiently managed.
3. Fix quality
Last but not least, the quality of service metric measures the number of defective fixes – those that failed to resolve the reported problem or caused a new problem after the fix. The fix quality assessments unfold during the testing phase, particularly in regression testing.
The testing team calculates the time that has passed between the detection and elimination of the defect. Thus, specialists lower the bar of reducing buyers’ interest in the product or dedicated QA cycles post-fix implementation.

Case in point
Throughout a month of development, a team implements 80 fixes. Upon thoroughly evaluating user feedback and testing, they discovered that 10 of these fixes were defective, representing a fix quality of 12.5%. This metric indicates that 12.5% of the implemented fixes exhibited shortcomings in addressing reported issues or introduced new concerns.
Tools to evaluate quality assurance metrics for software
When discussing software quality metrics, it is important to have an understanding of how to test the metrics. With that in mind, we’ve compiled a list of the software quality metrics tools.
- To assess the cyclomatic complexity of your codebase, various tools are available, such as CodeClimate, SonarQube, and Understand. These tools not only calculate the complexity but also offer suggestions to simplify the code, thereby enhancing its maintainability.
- Code coverage measurement can be done using tools like JaCoCo, Cobertura, and Istanbul. These tools provide detailed reports indicating which parts of the code are covered by tests and which are not.
- Code churn analysis can be done with Git, a widely used version control system. By using Git’s built-in features like git log and git diff, you can track changes made to your codebase and detect sections undergoing frequent changes.
- Code duplication detection can be accomplished using PMD (Programming Meticulous coDe, code analyzer), CPD (Copy/Paste Detector), and Simian tools that can detect sections of code that are similar or identical to others in the codebase.
- The maintainability index can be calculated by tools like CodeClimate, SonarQube, and Understand by analyzing various factors, including cyclomatic complexity, code duplication, and code coverage. This index provides an overall measure of the maintainability of the codebase.
Peiko is an experienced software development team
At Peiko, we help businesses get timely information from product quality metrics and take their products to a new level of quality. Our team’s striving to create quality software is seamlessly integrated with our adoption of the agile methodology with two-week sprints. Agile principles allow us to incorporate and adapt various software quality metrics into our workflow flexibly.
These metrics include lead time, cycle time, sprint velocity, code complexity, fix backlog, fix quality, and others. We intertwine agile practices with our meticulous attention to these metrics. Thus, we build an environment that not only ensures high-quality software solutions but also simplifies continuous enhancement and responsiveness to evolving projects’ needs.
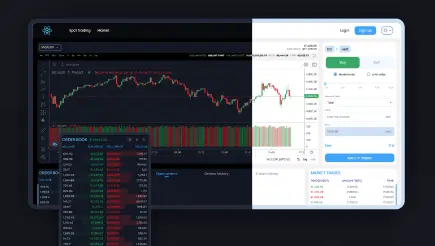
Let’s consider how we used quality metrics for software development on examples of one of our successful projects – the TopUp Balance App. It is a user-friendly online solution that helps to facilitate the replenishment of mobile operator accounts globally. It also offers the flexibility to purchase diverse digital products using cryptocurrency or traditional fiat currencies.
Our challenge as a software and blockchain development services provider was the integration of both fiat and crypto wallets. We incorporated multilingual support of 11 languages and developed a universal admin panel for seamless functionality management.

In the intricate process of crafting applications like TopUp Balance, our keen attention to lead time is fundamental. We manage this metric with precision, ensuring a swift implementation that prioritizes optimal development paths without compromising on quality.
Alongside the lead time metric, we use the cycle time metric in our project management approach. This meticulous monitoring of task duration allows us to streamline workflows to maximize efficiency while upholding the high quality our clients expect.
For projects governed by agile methodologies, sprint velocity becomes a critical metric for us. It provides a nuanced understanding of team productivity. Thus, we can adapt and optimize future sprints, increasing project efficiency.
Also, code complexity stands as a vital indicator in our development process. Using tools to receive the cyclomatic complexity metric, we can understand the structural intricacies of our code. This empowers us to identify and enhance areas that contribute to the general quality of software.
In our commitment to quality, the fix backlog metric guides our planning and management processes. It shows us unresolved issues, facilitating a proactive approach to issue resolution. Furthermore, fix quality becomes a paramount measure. This ensures that our bug fixes not only address reported problems but also maintain or improve system stability.
As a result of our work, the client got a reliable and efficient app that users like worldwide. Now, we are engaged in further support of the solution at the client’s request, who was satisfied with the work and decided to continue cooperation.
Our expertise at Peiko is deeply rooted in a skilled team of experts dedicated to creating excellence. Turn to us for the best IT outsourcing and IT outstaffing services. We will help you with any blockchain solution creation – whether a non-custodial wallet or robust crypto exchange.
In every project, we go beyond just providing custom software development services – we deliver reliable, efficient, and innovative solutions that exceed expectations.
Put quality at the top of your business priorities
In general, quality metrics in software testing and coding are necessary in order to improve the software development process and ensure that your product is of better quality and is in demand in the market.
We strongly recommend that you check that your project is ready to launch throughout the period of custom software development.
Don’t skip the testing and debugging process to avoid costly mistakes in the future! Contact Peiko, and you will have a unique opportunity to improve your product before it becomes a commodity.
No comments yet. Be the first to comment!